UX
visual design
mixed media
research
about
resume
UX
visual design
mixed media
research
about
resume
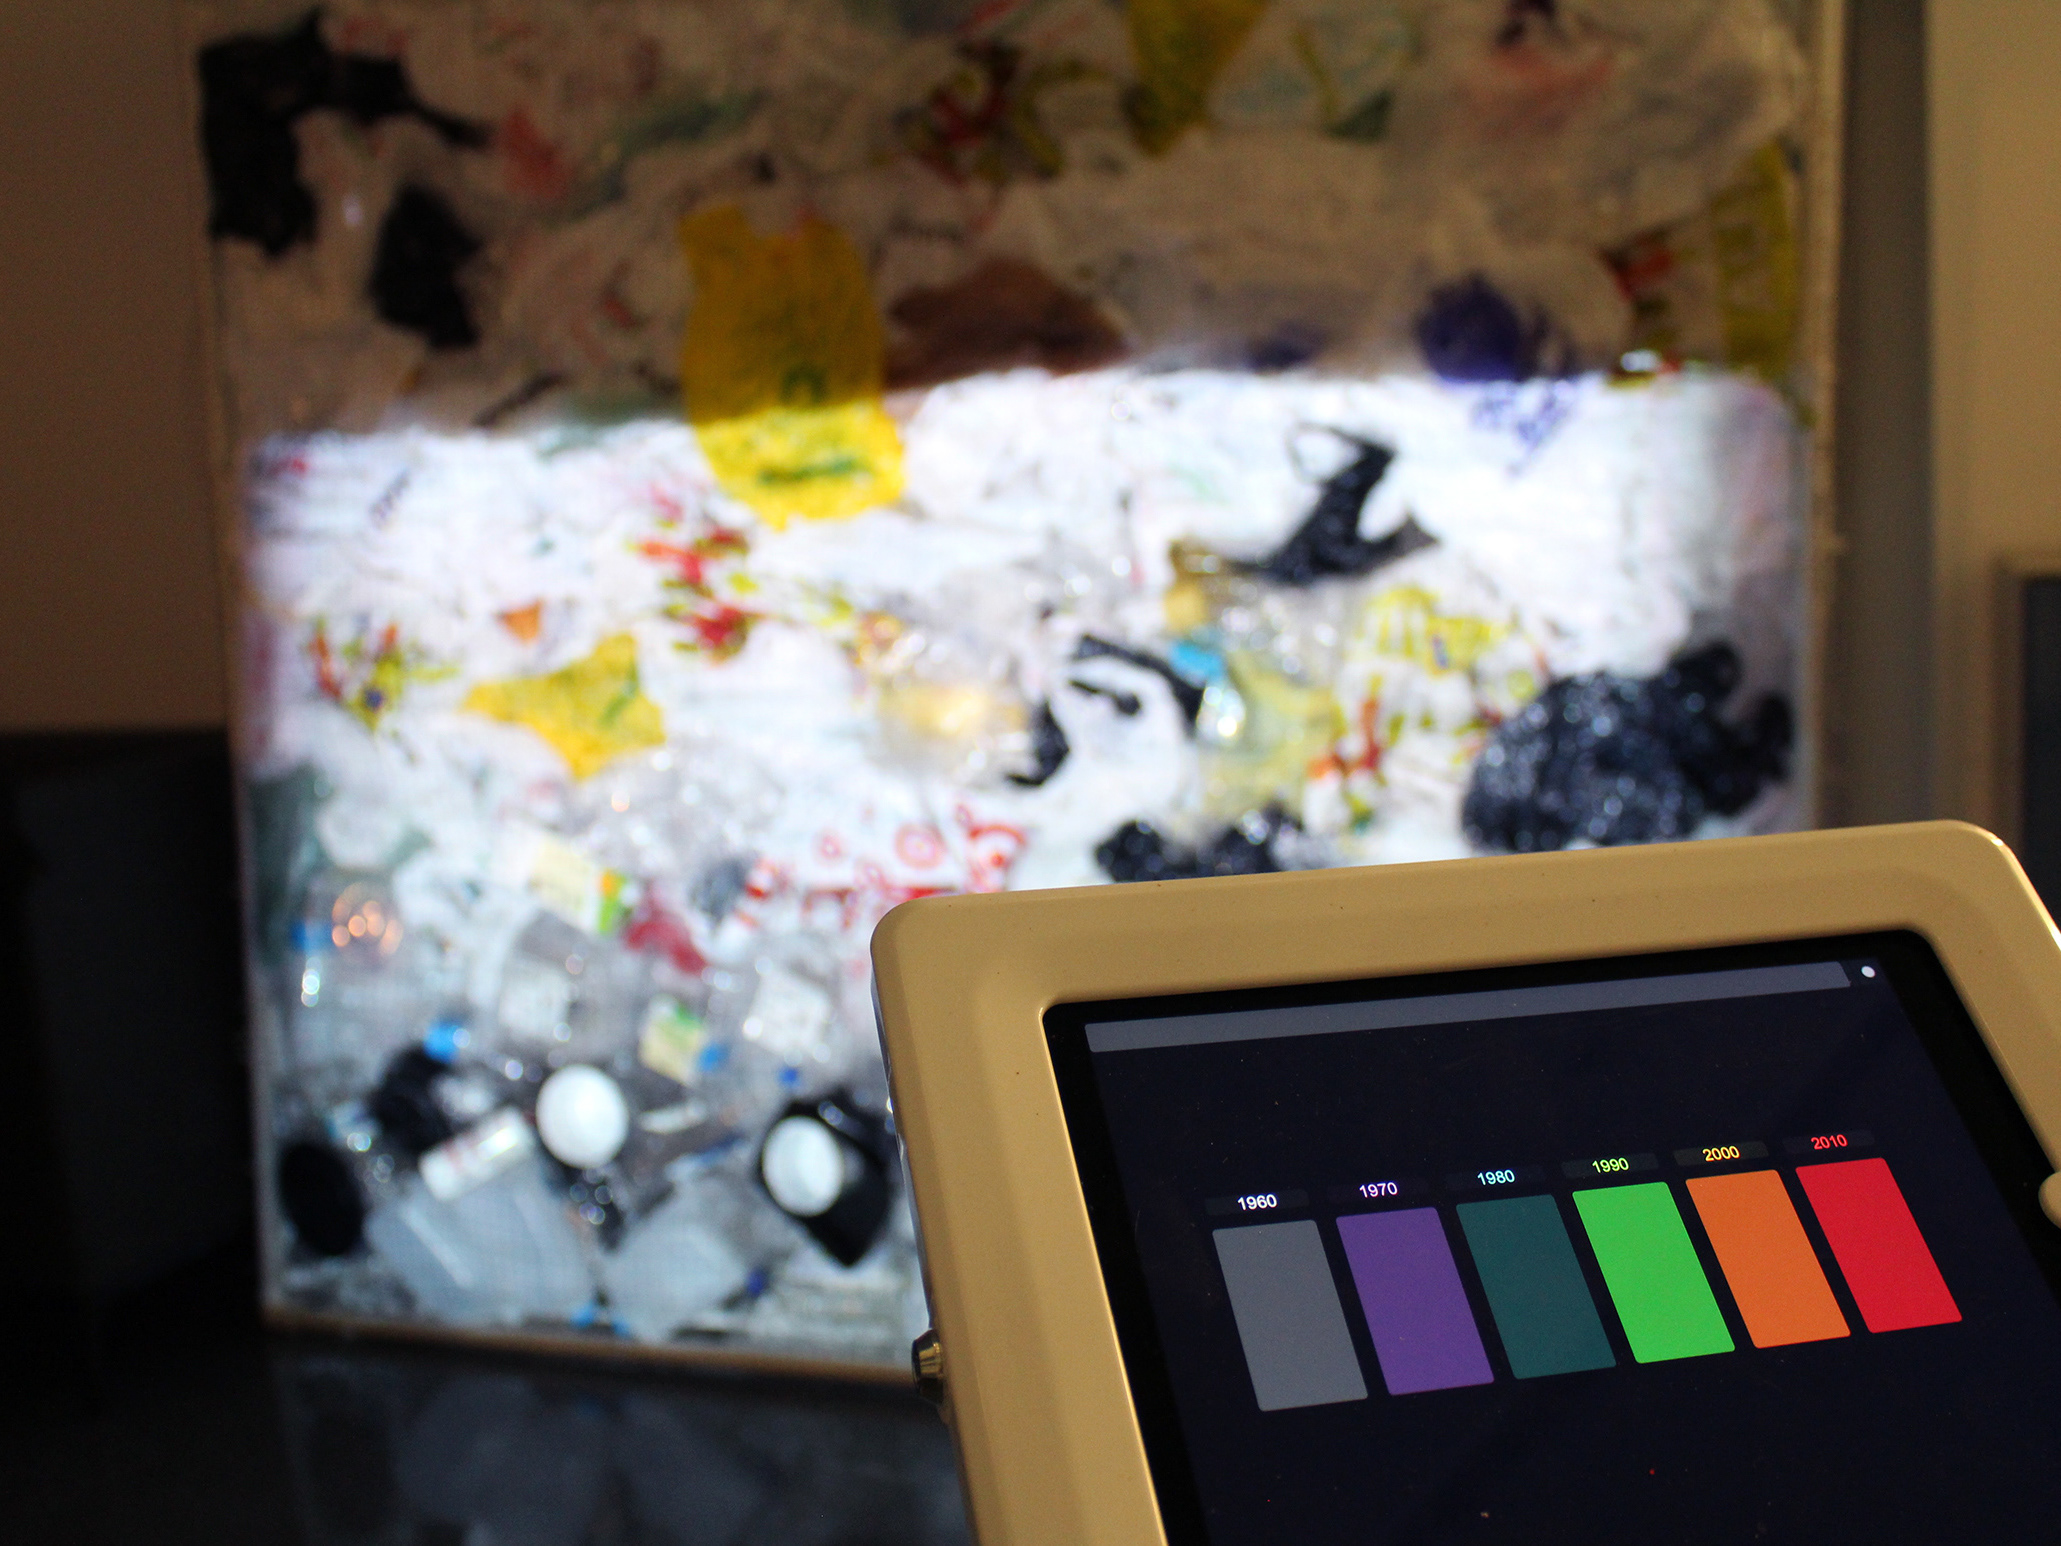
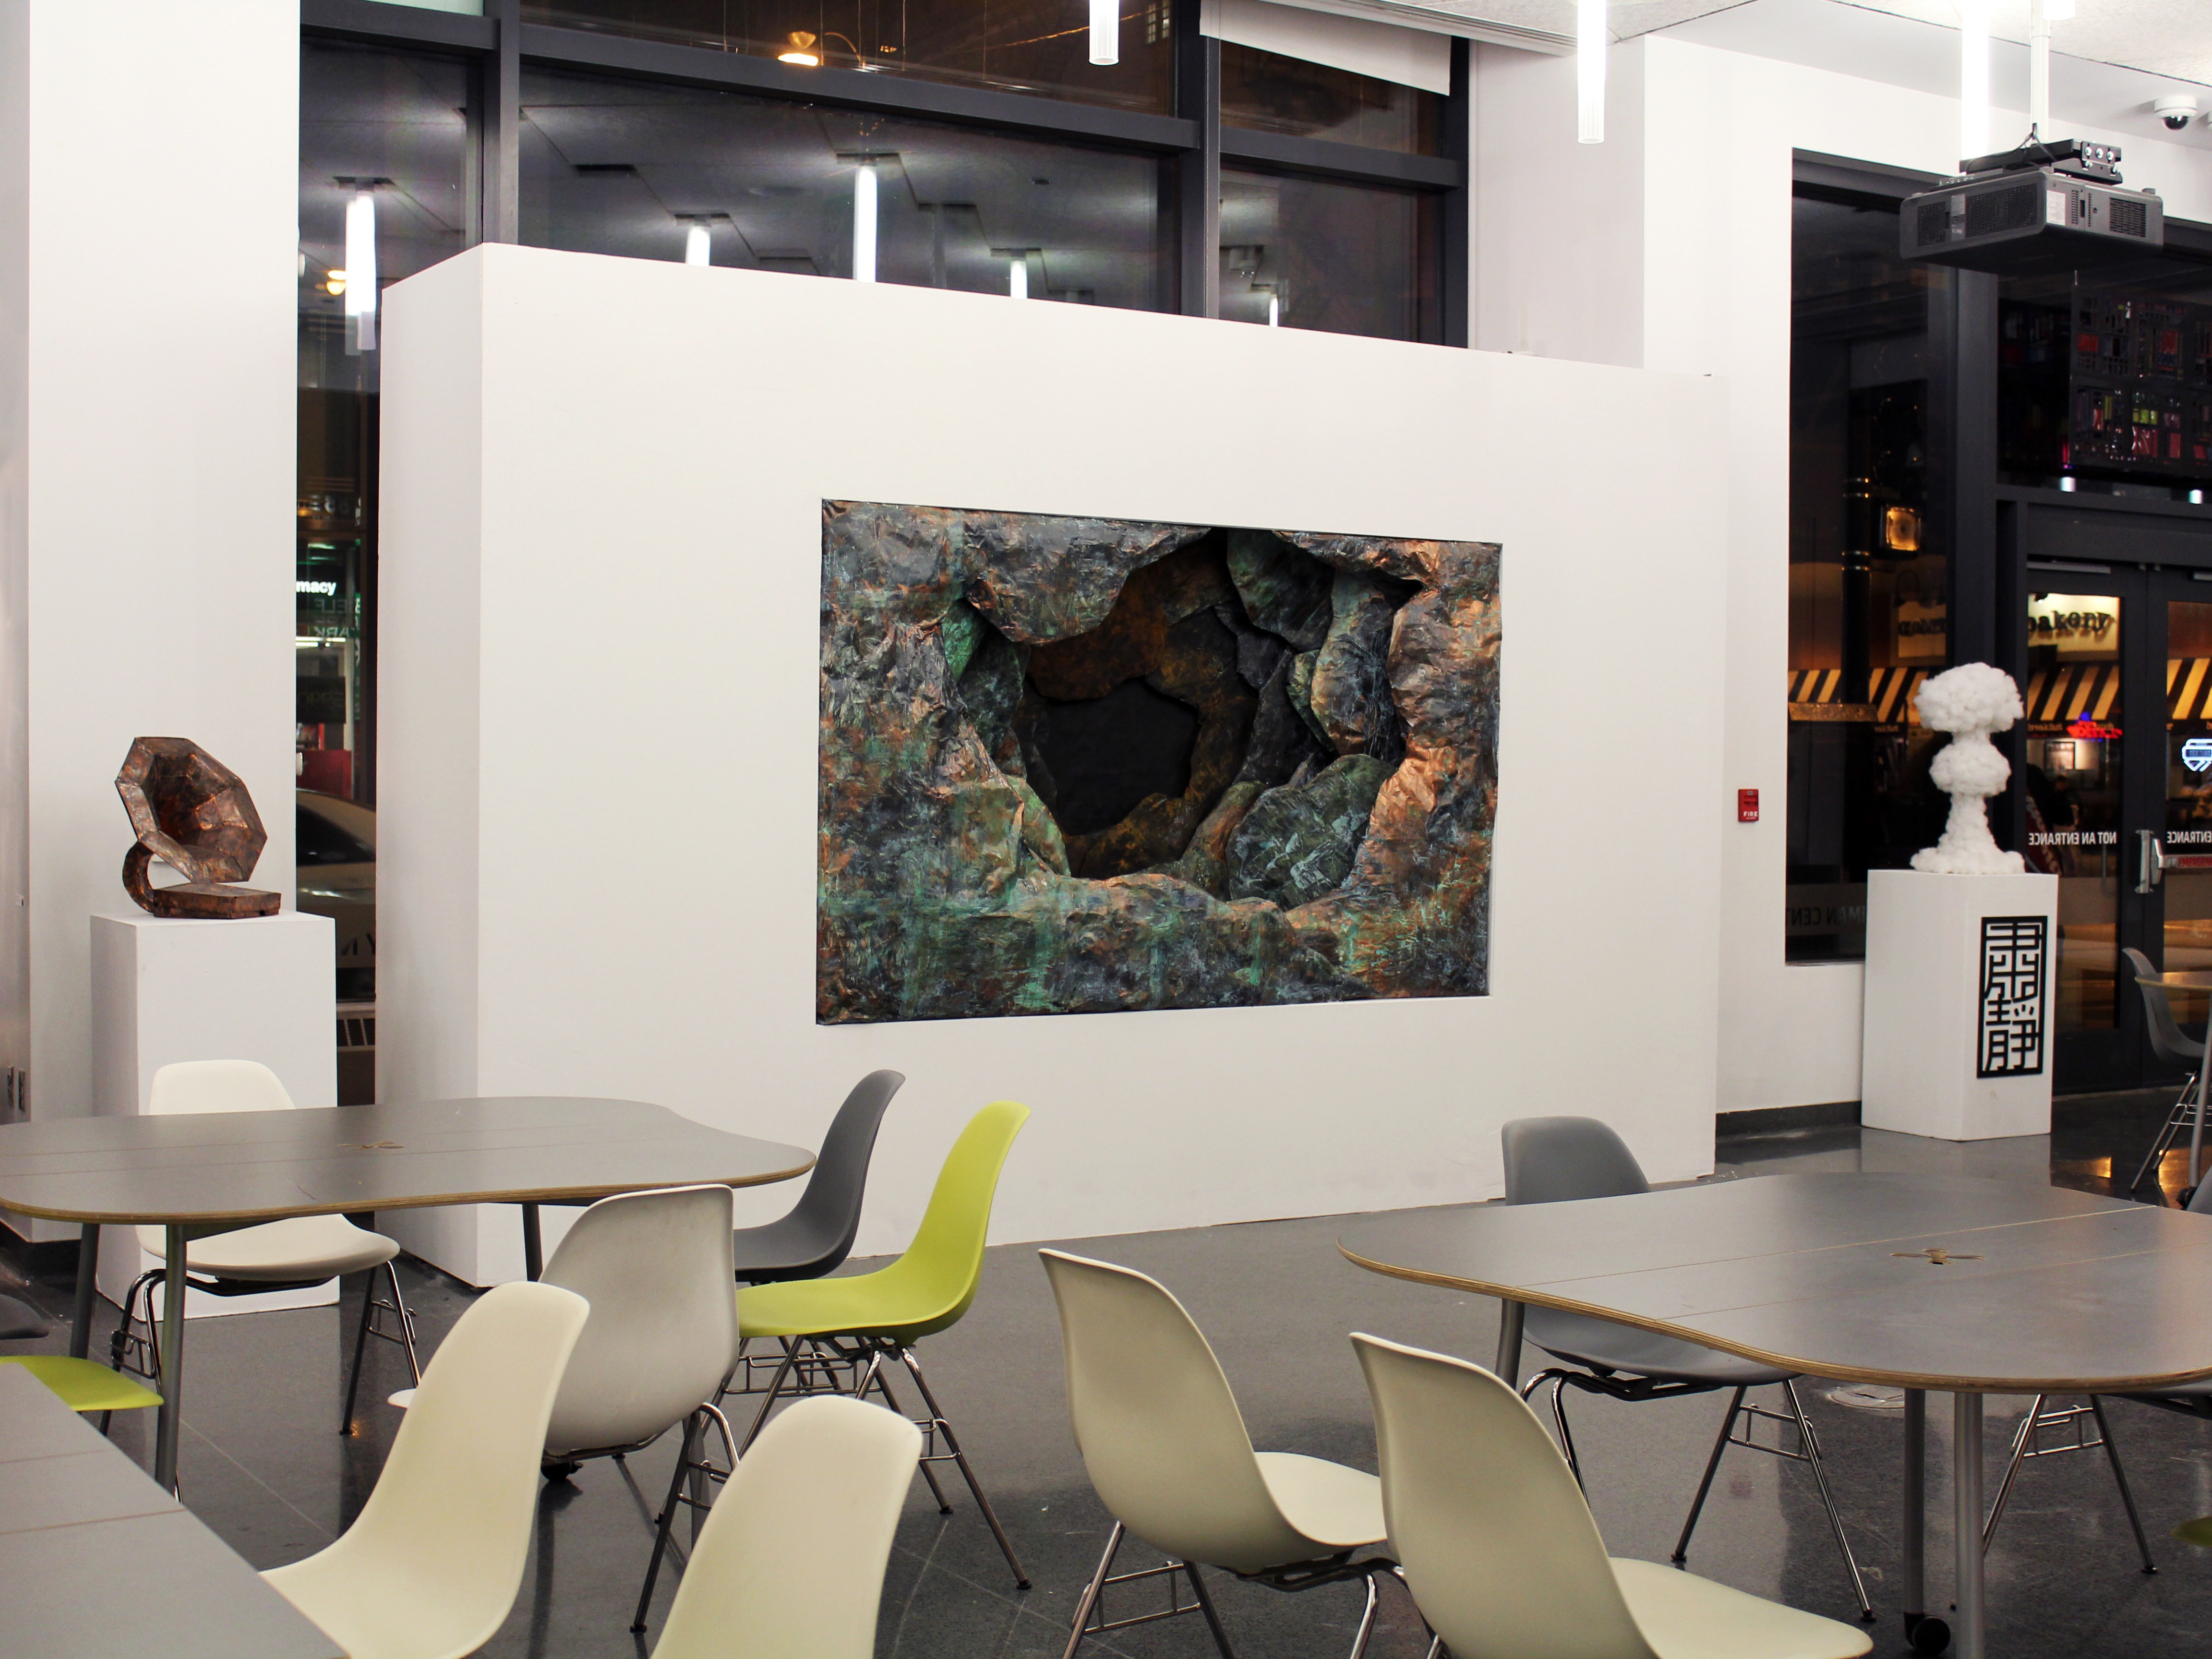
Experimental Data Visualization
Experimental Data Visualization, 2015
Images were converted to sound data, then the sound data was converted to new visualization through coding (Processing).
You may also like
Ambition
Color Us
Queen
68 Megatons
Oversight
Augmented Sculpture
Under the Influence Series
Logique & Gut Claymation
Blue
Drawings 2013-2014
↑
Back to Top